
Our Methodology
A structured, bottom-up research methodology — built upward from what actually exists on the ground, and layered through GIS with the data around every store.
Ground truths start at the store
Ground truths start at the store
Every insight begins with what actually exists on the ground — real outlets, physically verified by our own teams across the GCC.
Every brand, counted
Brands are measured by their real in-market presence — a footprint you can compare, not a claim you have to trust.
Who's really behind the market
Brands connect to the companies that run them — so the competitive picture reflects real ownership, not just storefronts.
Share is counted, not modeled
Because the ground level is covered, share is measured from evidence — benchmarked, defensible, explainable.
The market, scaled from the ground up
Market sizing built upward from verified reality — not downward from top-line assumptions.
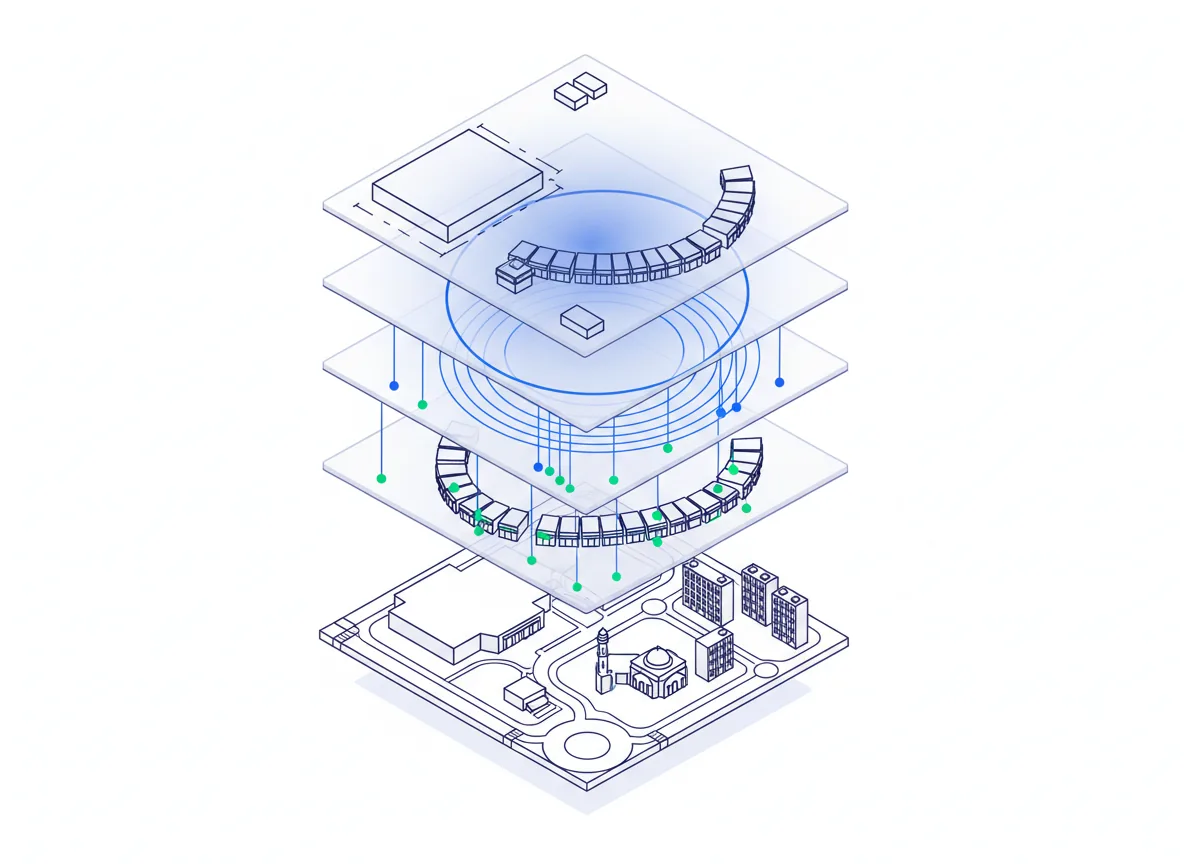
Rich GIS data layers drive every solution
Everything we deliver starts at the store level and is built up through GIS. Each outlet we count is placed on the map, then joined to the layers around it: the records we build ourselves in the field, and the external layers that describe the ground it stands on. The same layered base runs under every practice, from market sizing to site selection and tenant mix.
- Outlet census: footprint, format, brand and operator per store
- Brand-to-operator ownership links
- Real-estate assets, tenant mix and lease-rate benchmarks
- Outlet performance and sales estimates
- Population demographics
- Traffic and footfall
- Real-estate project pipeline
- Government registries: Ministry of Commerce, PACI, chambers of commerce
One store, two universes of insight
A store does not operate in isolation. Its success is tied to the real estate that hosts it, the dynamics of its trade area, the profile of the population around it, and how saturated its category already is. We read every outlet across two levels at once — the store in its physical context, and the market those stores add up to.
- Host real estate profile
- Trade area profile
- Supply benchmarking
- Demand benchmarking
- Brand
- Operator
- Market share
- Market size
Want the detailed version?
The complete methodology — frameworks, validation protocols, process detail — is shared as a document with engaged clients.